


Successful store management is achieved through "data".

What is ABEJA Insight for Retail?
Cameras and sensors are used to visualize "the number of customers, their attributes (gender, age), and foot traffic in front of the store."
This is a store analysis and operations support service that enables data-driven decision-making.
Our specialized success team provides comprehensive support, from data visualization to translating that data into concrete strategies.
Even those working with data for the first time can easily implement data-driven store management without any difficulty.
Do you have any of these problems?
They only see the "sales" results.
It is impossible to determine whether the effect of the measures is "increased customer traffic" or "improved purchase rate," and the results are not reproducible.
It is impossible to determine if the store's "report" is accurate.
The on-site reports lack supporting evidence, making it impossible to issue appropriate instructions.
Unable to break free from experience and intuition
The operation relies on years of experience and intuition (KKD), making it impossible to create a system for utilizing data.
The "priorities" for improvement are unclear.
We don't know where the problems lie—in terms of customer entry, browsing, or purchases—so our strategies are always reactive.
Policies are "just implemented and left unfinished."
The effectiveness of policies cannot be evaluated, and know-how on successes and failures is not accumulated within the organization.
"Specific measures"
It's not decided.
Because the issues haven't been identified, resources are being wasted on measures that lack a solid foundation.
The reasons for sales are not reflected in POS data.

ABEJA Insight for Retail investigated where in the store customers got lost and why they put items back in front of the shelves.
By visualizing the "gap before purchase" that cannot be seen with POS data, we enable store management that does not rely on intuition.
Created by ABEJA Insight for retail
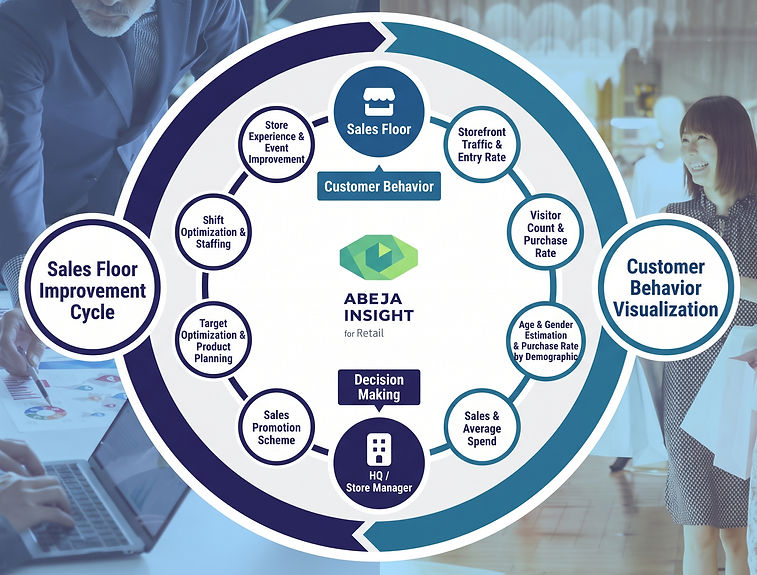
A data-driven system where the PDCA cycle continues to run.
We create a "PDCA cycle" that allows for continuous improvement and verification, starting with customer behavior occurring in the sales area.



Foot traffic in front of the store
In addition to understanding the amount of foot traffic in front of the store by time of day, day of day, and month, by linking it with POS data...
The system can also automatically calculate and visualize the customer occupancy rate for each store.
By understanding the store's occupancy rate, it becomes possible to measure the effectiveness of attracting customers through changes to the store's facade visual merchandising (VMD).
Dashboard
Correlation analysis with other items is also possible.


The dashboard displays measurement results in a tree format of sales components. By linking with POS data, it is possible to automatically calculate and display figures such as store entry rate and purchase rate.
The data analysis screen allows you to easily analyze how changes in the number of customers affect other indicators such as average customer spending, sales, and purchase rates. This makes it possible to evaluate the effectiveness of measures aimed at increasing sales.

.png)
.png)
.png)
.png)
.png)
.png)
.png)
Why choose ABEJA Insight for Retail?
High accuracy and stability of data acquisition.
Thorough support for effective utilization, not just "implementation and then the end."
Our proprietary product boasts a track record of AI implementation with over 350 companies.
.png)
.png)
.png)
Our proprietary AI algorithm enables highly accurate and stable data acquisition, unaffected by environmental factors.
How to interpret data, draw insights, formulate and implement policies,
We support the establishment of the PDCA cycle, including review.
Our development system boasts superior quality and speed, based on the experience and knowledge gained from developing and supporting AI-integrated products for companies across various industries.
Reasons why data utilization is becoming established in the workplace
We visualize KPIs and break down the sales equation—"Foot traffic in front of the store → Store entry rate → Purchase rate (POS integration)"—for management.
Headquarters and the field can use the same data to guide improvement actions.

By combining "AI-driven analysis" and "support from customer success teams," we identify issues from data and assist in planning and executing concrete improvement actions.
Case Studies
We interviewed companies that have actually implemented the system to find out what results they have achieved since then.
Tutuanna Co., Ltd.

From analyzing store entry and purchase rates to implementing sales improvement strategies: Instilling a data-driven culture in the operation of 250 stores nationwide.
Vinos Yamazaki Co., Ltd.

Scientifically analyzing the effectiveness of policies and store staff training—Vinos Yamazaki Co., Ltd. approaches store improvement with "reliable data"
ICI Ishii Sports Co., Ltd.

By quantifying the customer visit rate, we were able to discover merchandise strategies that lead to new customers.
assignment
POS data makes it difficult to understand customer behavior prior to sales, making it challenging to develop store improvement strategies.
assignment
It's difficult to determine whether fluctuations in sales are due to changes in the number of customers or differences in customer service skills, making evaluation and training challenging.
assignment
I want to move beyond experience and intuition and accumulate know-how in store management.
The process leading up to implementation


From application to measurement, you can start acquiring store and customer data in as little as one month.


Copyright©ABEJA, Inc. All rights reserved.


